CrewCtf Writeups
It has been a while since I last participated in a CTF (Capture The Flag) competition. With a few moments to spare this weekend, I decided to immerse myself in CrewCTF by theHackersCrew CTF team. Their event offered a diverse range of challenges, but I chose to focus primarily on the fascinating field of forensics. In this blog, I will share my approach and solutions for the different challenges I managed to solve.
Catalog⌗
- Encrypt10n
- Encrypt10n 2
- Attack 1
- Attack 2
- Attack 3
- Attack 4
- Attack 5
- Attack 6
- Attack 7
- Attack 8
- Attack 9
- References
Encrypt10n⌗
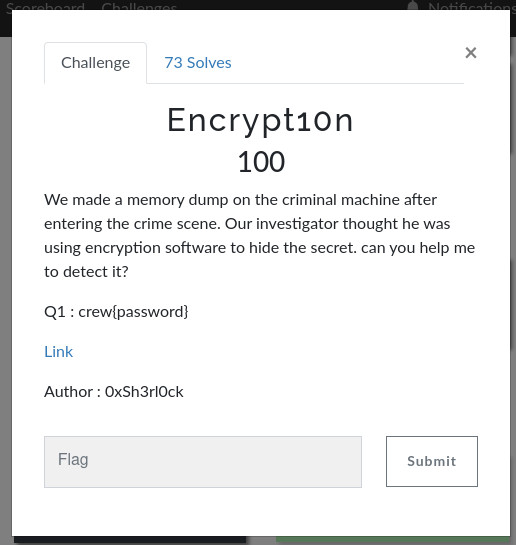
- In this challenge, we are given a live memory dump of a machine. Running the
filecommand on the file, the file is only recognized as adata filewhich is not helpful
$ file dump.mem
dump.mem: data
- Running strings on the file however, gives us the following information which hint on the file being a live memory dump of a vmware virtual machine. The file size is also a good hint that the file is a memory dump
$ strings dump.mem| head
FACP
INTEL 440BX
PTL @B
SRAT
CVMWAREMEMPLUG
VMW
WAET(
bVMWAREVMW WAET
VMW
HPET8

$ exiftool dump.mem
ExifTool Version Number         : 12.40
File Name                       : dump.mem
Directory                       : .
File Size                       : 1024 MiB
- Since we now have an idea that the file is a memory dump, we can try to analyze the file with tools such as
volatility, a tool suited for analysis of memory dumps, to gain insights on the file. - The first thing to do, is to determine the operating system from which the memory dump was acquired. This can be achieved using the
imageinfoplugin in volatility. This gives us the best profile to use while doing further analysis along the way
$ volatility -f dump.mem imageinfo
Volatility Foundation Volatility Framework 2.6.1
INFO    : volatility.debug    : Determining profile based on KDBG search...
          Suggested Profile(s) : Win7SP1x86_23418, Win7SP0x86, Win7SP1x86_24000, Win7SP1x86
                     AS Layer1 : IA32PagedMemoryPae (Kernel AS)
                     AS Layer2 : FileAddressSpace (/media/zerofrost/Attack/dump.mem)
                      PAE type : PAE
                           DTB : 0x185000L
                          KDBG : 0x82b3db78L
          Number of Processors : 1
     Image Type (Service Pack) : 1
                KPCR for CPU 0 : 0x839a5000L
             KUSER_SHARED_DATA : 0xffdf0000L
           Image date and time : 2023-02-16 12:03:16 UTC+0000
     Image local date and time : 2023-02-16 14:03:16 +0200
From the above, we get three suggested profiles i.e
Win7SP1x86_23418, Win7SP0x86, Win7SP1x86_24000, Win7SP1x86. Here, we pick the first one as the best to useFrom the hint of the challenge, we know there is a type of encryption utilized and we need to find the password used for the encryption. Running
volatility -h, we get a list of supported plugins.
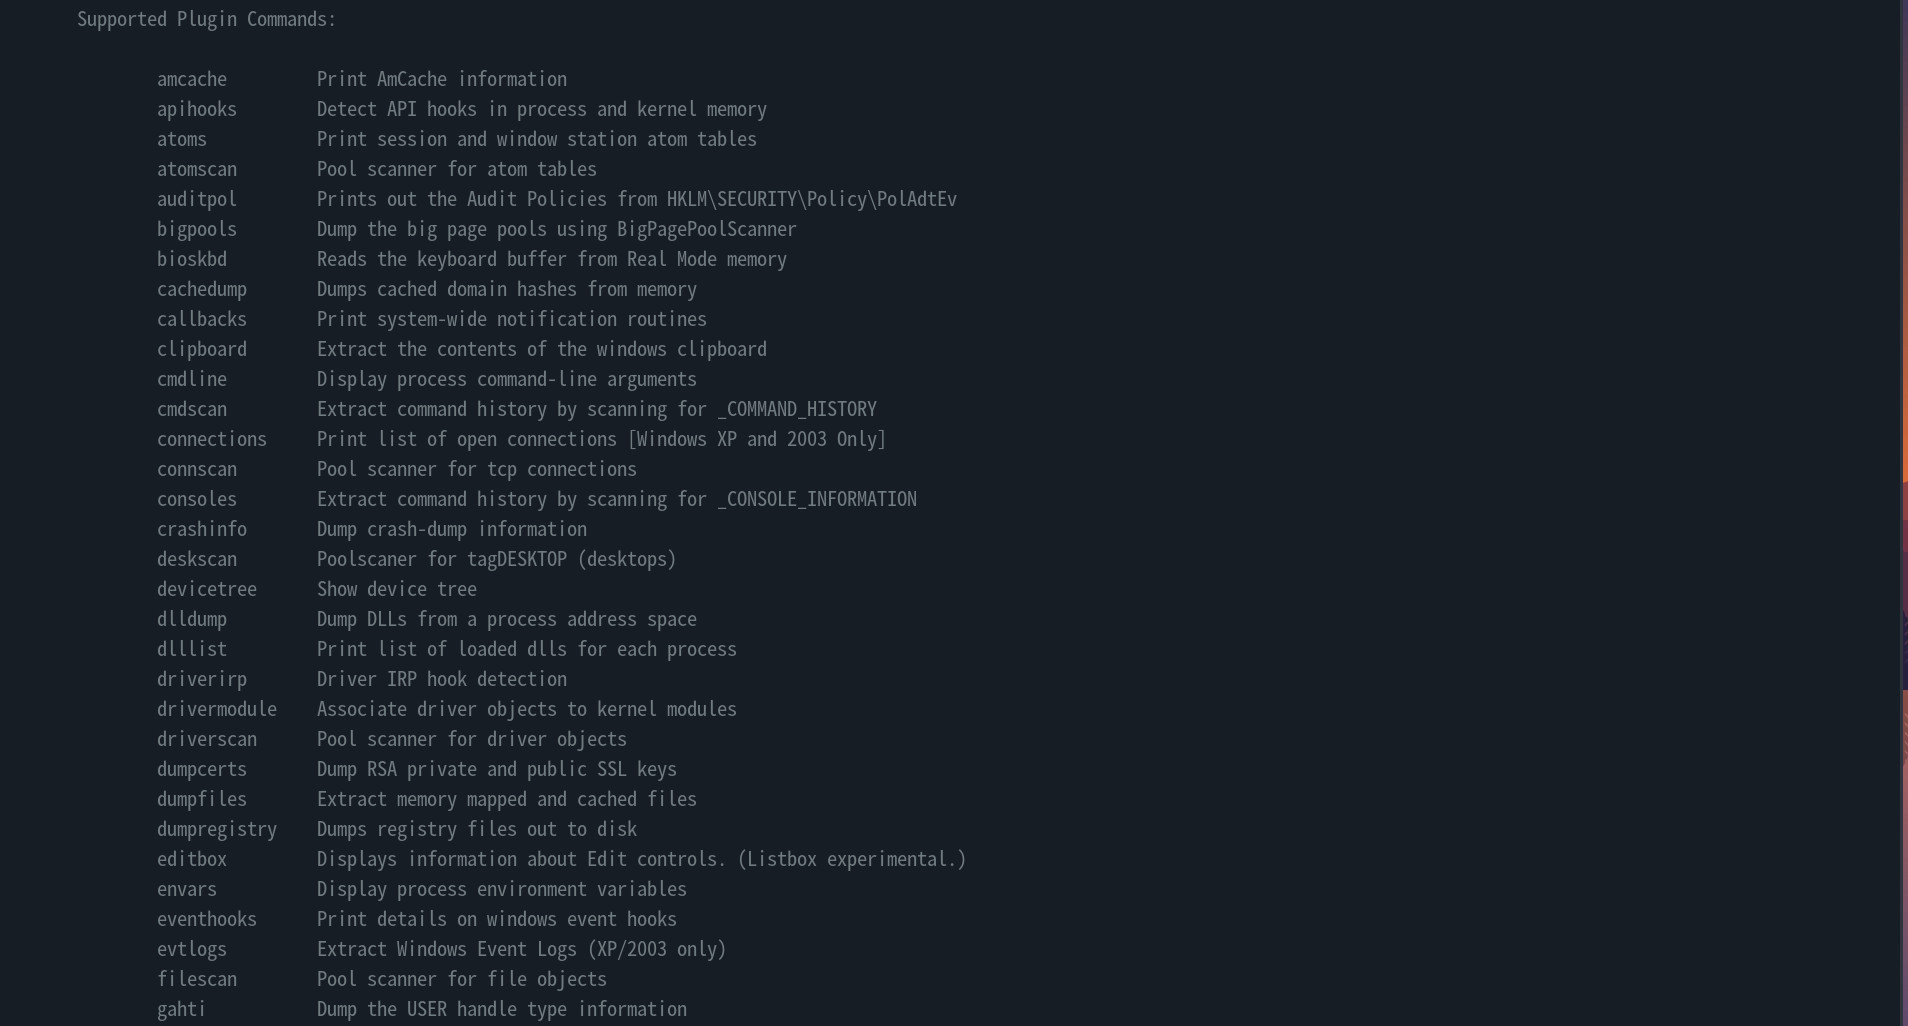
- All we need to do, is try and figure out if there are any plugins related to encryption, then we can use grep to fetch plugins related to encryption as follows
# Here we search for crypt to find plugins related to encryption and decryption. The word that would match both is crypt

$ volatility -h | grep -i crypt
Volatility Foundation Volatility Framework 2.6.1
		lsadump        	Dump (decrypted) LSA secrets from the registry
		truecryptmaster	Recover TrueCrypt 7.1a Master Keys
		truecryptpassphrase	TrueCrypt Cached Passphrase Finder
		truecryptsummary	TrueCrypt Summary
- Since we know we are looking for a password, the
truecryptpassphrase - TrueCrypt Cached Passphrase Finderplugin looks more promising from the set. To extract the passphrase, we specify the profile we chose ie.Win7SP1x86_23418and the plugin to usetruecryptpassphrase.
$ volatility -f dump.mem --profile=Win7SP1x86_23418 truecryptpassphrase
Volatility Foundation Volatility Framework 2.6.1
Found at 0x8d23de44 length 20: Strooooong_Passwword
- From the above, we get the flag
crew{Strooooong_Passwword}
Encrypt10n 2⌗
- Now that we have the password, we need to use it to get the secret message. We can first use the
truecryptsummaryplugin to get a summary related to the use of truecrypt in the machine
$ volatility -f dump.mem --profile=Win7SP1x86_23418 truecryptsummary
Volatility Foundation Volatility Framework 2.6.1
Registry Version     TrueCrypt Version 7.0a
Password             Strooooong_Passwword at offset 0x8d23de44
Process              TrueCrypt.exe at 0x85c596c0 pid 3196
Service              truecrypt state SERVICE_RUNNING
Kernel Module        truecrypt.sys at 0x8d20a000 - 0x8d241000
Symbolic Link        Volume{a2e4e949-a9a8-11ed-859c-50eb71124999} -> \Device\TrueCryptVolumeZ mounted 2023-02-16 12:02:56 UTC+0000
Driver               \Driver\truecrypt at 0x3f02fc98 range 0x8d20a000 - 0x8d240980
Device               TrueCrypt at 0x84e2a9d8 type FILE_DEVICE_UNKNOWN
- From the above snippet, we see
TrueCrypt.exe at 0x85c596c0 pid 3196from the truecryptsummary that tells us that the truecrypt process is running and has a pid of3196, we can perform a memory dump of the process and try to gain some insight related to the process. To dump the memory of a process, we use thememdumpplugin and specify the pid with-poption and then specify the directory where the output will be stored ie./tmp/testing
$ volatility -f dump.mem --profile=Win7SP1x86_23418 memdump -p 3196 --dump-dir /tmp/testing
Volatility Foundation Volatility Framework 2.6.1
************************************************************************
Writing TrueCrypt.exe [  3196] to 3196.dmp
- The memory dump of the truecrypt process is stored as
3196.dump. Running strings on the process dump and grepping for the string\flag, we can see that the flag file is indeed encrypted via truecrypt and its location was atC:\Users\0xSh3rl0ck\Desktop\flagwhich matches the attached file given for this challenge.
$ strings 3196.dmp | grep -i "\flag"
\Users\0xSh3rl0ck\Desktop\flag
\Users\0xSh3rl0ck\Desktop\flag
		<volume>C:\Users\0xSh3rl0ck\Desktop\flag</volume>
		<volume>C:\Users\0xSh3rl0ck\Desktop\flag.txt</volume>
- Now that we have both the password and the encrypted file,we can use the
cryptsetuptool to open the encrypted fileflag. We need to specify a type oftcrypt(specifies that the encryption type is truecrypt) and then give a name ofnew_flag. We also type the password we found earlier.
$ cryptsetup --type tcrypt open flag new_flag
Enter passphrase for /tmp/testing/flag: Strooooong_Passwword
- We can then create a new folder
/mnt/flagwhere we will mountnew_flag. Once that is done, we can then mount it with themountcommand as follows
$ mkdir /mnt/flag
$ sudo mount -o uid=1000 /dev/mapper/new_flag /mnt/flag
- Once mounted, we can view the decrypted file
$ ls -al /mnt/flag
total 12
drwxrwxrwx 1 kali root 4096 Feb 16 06:38 .
drwxr-xr-x 4 root root 4096 Jul 11 14:11 ..
-rwxrwxrwx 2 kali root 2360 Feb 11 12:08 flaaaaaaaaaaaaaaaaaaaaaaaag.txt
- Opening the file, we see that the file is base64 encoded several times.

- We can base64 decode it several times until we get the flag

- We get the flag
crew{Tru33333_Crypt_w1th_V014t1l1ty!}
Attack 1⌗
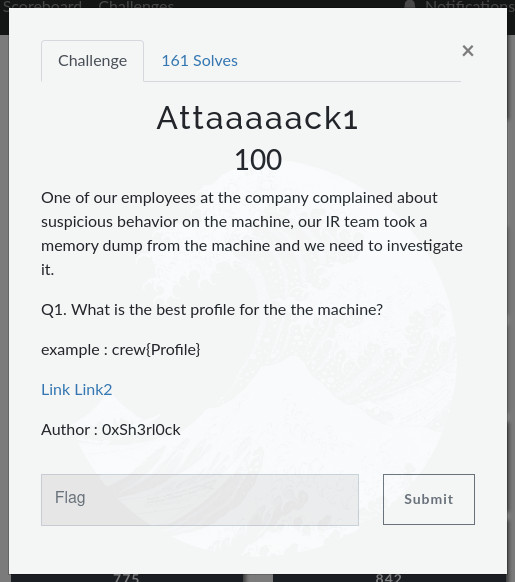
- First we find some basic information about the memory dump using the
fileandvolatilitycommands in linux
$ file memdump.raw
memdump.raw: data

$ volatility -f memdump.raw imageinfo

Volatility Foundation Volatility Framework 2.6.1
INFO    : volatility.debug    : Determining profile based on KDBG search...
          Suggested Profile(s) : Win7SP1x86_23418, Win7SP0x86, Win7SP1x86_24000, Win7SP1x86
                     AS Layer1 : IA32PagedMemoryPae (Kernel AS)
                     AS Layer2 : FileAddressSpace (/media/zerofrost/STUFF/bitclan/crewctf/forensics/memdump.raw)
                      PAE type : PAE
                           DTB : 0x185000L
                          KDBG : 0x82b7ab78L
          Number of Processors : 1
     Image Type (Service Pack) : 1
                KPCR for CPU 0 : 0x80b96000L
             KUSER_SHARED_DATA : 0xffdf0000L
           Image date and time : 2023-02-20 19:10:54 UTC+0000
     Image local date and time : 2023-02-20 21:10:54 +0200
- From volatility , checking the
Suggested Profile(s), the best profile to use isWin7SP1x86_23418
Attack 2⌗
- To find the number of processes running, we can run the
pslistplugin
volatility -f memdump.raw --profile=Win7SP1x86_23418 pslist
Volatility Foundation Volatility Framework 2.6.1
Offset(V)  Name                    PID   PPID   Thds     Hnds   Sess  Wow64 Start                          Exit
---------- -------------------- ------ ------ ------ -------- ------ ------ ------------------------------ ------------------------------
0x8419c020 System                    4      0     89      536 ------      0 2023-02-20 19:01:19 UTC+0000
0x962f2020 smss.exe                268      4      2       29 ------      0 2023-02-20 19:01:19 UTC+0000
0x860a8c78 csrss.exe               352    344      9      462      0      0 2023-02-20 19:01:20 UTC+0000
0x855dfd20 wininit.exe             404    344      3       76      0      0 2023-02-20 19:01:20 UTC+0000
0x8550b030 csrss.exe               416    396      9      268      1      0 2023-02-20 19:01:20 UTC+0000
0x85ea2368 services.exe            480    404      8      220      0      0 2023-02-20 19:01:20 UTC+0000
0x85ea8610 lsass.exe               488    404      6      568      0      0 2023-02-20 19:01:20 UTC+0000
0x85eab718 lsm.exe                 496    404     10      151      0      0 2023-02-20 19:01:20 UTC+0000
0x85eacb80 winlogon.exe            508    396      5      115      1      0 2023-02-20 19:01:20 UTC+0000
0x85f4d030 svchost.exe             632    480     10      357      0      0 2023-02-20 19:01:21 UTC+0000
0x85ef0a90 svchost.exe             700    480      8      280      0      0 2023-02-20 19:01:21 UTC+0000
0x919e2958 svchost.exe             752    480     22      507      0      0 2023-02-20 19:01:21 UTC+0000
0x85f9c3a8 svchost.exe             868    480     13      309      0      0 2023-02-20 19:01:21 UTC+0000
0x85fae030 svchost.exe             908    480     18      715      0      0 2023-02-20 19:01:21 UTC+0000
0x85fb7670 svchost.exe             952    480     34      995      0      0 2023-02-20 19:01:22 UTC+0000
0x85ff1380 svchost.exe            1104    480     18      391      0      0 2023-02-20 19:01:22 UTC+0000
0x8603a030 spoolsv.exe            1236    480     13      270      0      0 2023-02-20 19:01:22 UTC+0000
0x86071818 svchost.exe            1280    480     19      312      0      0 2023-02-20 19:01:22 UTC+0000
0x860b73c8 svchost.exe            1420    480     10      146      0      0 2023-02-20 19:01:22 UTC+0000
0x860ba030 taskhost.exe           1428    480      9      205      1      0 2023-02-20 19:01:22 UTC+0000
0x861321c8 dwm.exe                1576    868      5      114      1      0 2023-02-20 19:01:23 UTC+0000
0x8613c030 explorer.exe           1596   1540     29      842      1      0 2023-02-20 19:01:23 UTC+0000
0x841d7500 VGAuthService.         1636    480      3       84      0      0 2023-02-20 19:01:23 UTC+0000
0x86189d20 vmtoolsd.exe           1736   1596      8      179      1      0 2023-02-20 19:01:23 UTC+0000
0x8619dd20 vm3dservice.ex         1848    480      4       60      0      0 2023-02-20 19:01:24 UTC+0000
0x861a9030 vmtoolsd.exe           1884    480     13      290      0      0 2023-02-20 19:01:24 UTC+0000
0x861b5360 vm3dservice.ex         1908   1848      2       44      1      0 2023-02-20 19:01:24 UTC+0000
0x861fc700 svchost.exe             580    480      6       91      0      0 2023-02-20 19:01:25 UTC+0000
0x86261030 WmiPrvSE.exe           1748    632     10      204      0      0 2023-02-20 19:01:25 UTC+0000
0x86251bf0 dllhost.exe             400    480     15      196      0      0 2023-02-20 19:01:26 UTC+0000
0x8629e518 msdtc.exe              2168    480     14      158      0      0 2023-02-20 19:01:31 UTC+0000
0x8629e188 SearchIndexer.         2276    480     12      581      0      0 2023-02-20 19:01:31 UTC+0000
0x8630b228 wmpnetwk.exe           2404    480      9      212      0      0 2023-02-20 19:01:32 UTC+0000
0x862cca38 svchost.exe            2576    480     15      232      0      0 2023-02-20 19:01:33 UTC+0000
0x85351030 WmiPrvSE.exe           3020    632     11      242      0      0 2023-02-20 19:01:45 UTC+0000
0x853faac8 ProcessHacker.         3236   1596      9      416      1      0 2023-02-20 19:02:37 UTC+0000
0x843068f8 sppsvc.exe             2248    480      4      146      0      0 2023-02-20 19:03:25 UTC+0000
0x85f89640 svchost.exe            2476    480     13      369      0      0 2023-02-20 19:03:25 UTC+0000
0x843658d0 cmd.exe                2112   2876      1       20      1      0 2023-02-20 19:03:40 UTC+0000
0x84368798 cmd.exe                2928   2876      1       20      1      0 2023-02-20 19:03:40 UTC+0000
0x84365c90 conhost.exe            1952    416      2       49      1      0 2023-02-20 19:03:40 UTC+0000
0x84384d20 conhost.exe            2924    416      2       49      1      0 2023-02-20 19:03:40 UTC+0000
0x84398998 runddl32.exe            300   2876     10     2314      1      0 2023-02-20 19:03:40 UTC+0000
0x84390030 notepad.exe            2556    300      2       58      1      0 2023-02-20 19:03:41 UTC+0000
0x84df2458 audiodg.exe            1556    752      6      129      0      0 2023-02-20 19:10:50 UTC+0000
0x84f1caf8 DumpIt.exe             2724   1596      2       38      1      0 2023-02-20 19:10:52 UTC+0000
0x84f3d878 conhost.exe            3664    416      2       51      1      0 2023-02-20 19:10:52 UTC+0000
- Counting the number of processes, we get 47
Attack 3⌗
- For this challenge, we are told the user left a note on the machine. I thought that the note left by the user was a file, however, after searching for probable notes using the
filescancommand, I did not find any file containing the note by the user. I then went through the volatility plugins and found aclipboardplugin. The clipboard plugin shows the contents on the clipboard (data copied by the user) when the memory dump was done. Checking the contents of the clipboard, i got the flag.
$ volatility -f memdump.raw  --profile=Win7SP1x86_23418 clipboard
Volatility Foundation Volatility Framework 2.6.1
Session    WindowStation Format                 Handle Object     Data
---------- ------------- ------------------ ---------- ---------- --------------------------------------------------
         1 WinSta0       CF_UNICODETEXT        0xa00d9 0xfe897838 1_l0v3_M3m0ry_F0r3ns1cs_S0_muchhhhhhhhh
         1 WinSta0       0x0L                     0x10 ----------
         1 WinSta0       0x2000L                   0x0 ----------
         1 WinSta0       0x0L                   0x3000 ----------
         1 ------------- ------------------   0x1a02a9 0xfe670a68
         1 ------------- ------------------   0x100067 0xffbab448
- The flag is
crew{1_l0v3_M3m0ry_F0r3ns1cs_S0_muchhhhhhhhh}
Attack 4⌗
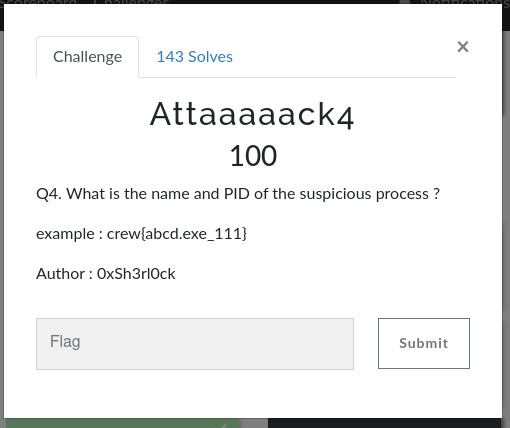
- Using the
cmdlineplugin ,we can check the commandline history for suspicious commands that were run as follows. From the history below, we see a suspicious processrunddl32.exethat was run fromC:\Users\0XSH3R~1\AppData\Local\Temp\MSDCSC\runddl32.exeand has a process id(pid) of300. Therunddl32.exeplugin is suspicious as it impersonates a legit windows process calledrundll32.exe
$ volatility -f memdump.raw --profile=Win7SP1x86_23418 cmdline
Volatility Foundation Volatility Framework 2.6.1
************************************************************************
System pid:      4
************************************************************************
smss.exe pid:    268
Command line : \SystemRoot\System32\smss.exe
************************************************************************

....  SNIP .....

runddl32.exe pid:    300
Command line : "C:\Users\0XSH3R~1\AppData\Local\Temp\MSDCSC\runddl32.exe"
************************************************************************
- The flag is
crew{runddl32.exe_300}
Attack 5⌗
- Checking the child process of the previously found process, we find
notepad.exe. The processnotepad.exeis called by the malicious processrunddl32.exehence the two are related
$ volatility -f memdump.raw --profile=Win7SP1x86_23418 pstree
Volatility Foundation Volatility Framework 2.6.1
Name                                                  Pid   PPid   Thds   Hnds Time
-------------------------------------------------- ------ ------ ------ ------ ----


 0x84368798:cmd.exe                                  2928   2876      1     20 2023-02-20 19:03:40 UTC+0000
 0x84398998:runddl32.exe                              300   2876     10   2314 2023-02-20 19:03:40 UTC+0000
. 0x84390030:notepad.exe                             2556    300      2     58 2023-02-20 19:03:41 UTC+0000
- The flag is
crew{notepad.exe}
Attack 6⌗
- To find the full path of the executable , we can use the
filescanplugin and grep forrunddl32.exewhich gives us the full path of the executable

- The flag is
crew{C:\Users\0XSH3R~1\AppData\Local\Temp\MSDCSC\runddl32.exe}
Attack 7⌗
- To find the API used by the malware, we need to dump file malware from the memory dump so that we can analyse it further. From the previous file scan, we found that the malware is at the offset
0x0000000024534f80. We can dump it using thedumpfilesvolatility module and specify the offset as the parameter for-Qand then specify the directory to store it in--dump-dir

- Once the malware executable has been dumped, we can find it stored at
/tmp/test/file.None.0x8436b6f0.imgin our local machine. We can verify the file type of the malware executable and the try to find strings that contain the wordkeyas follows.
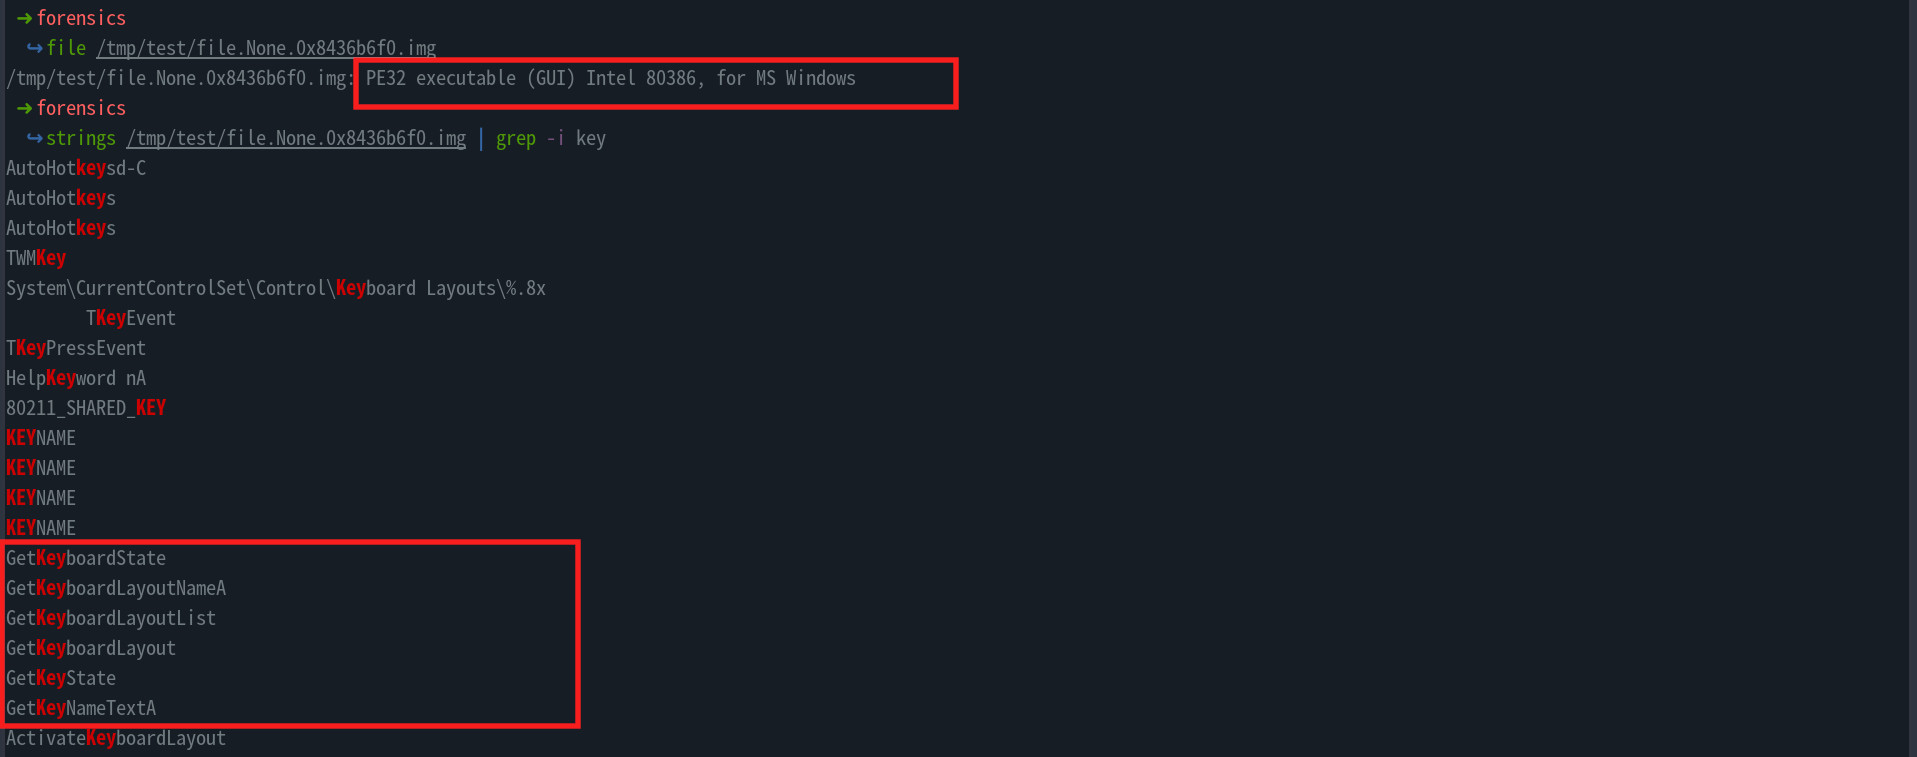
- From the results above, we find a few windows APIs that could be related to what we are looking for
- After googling about each of the keys, we find that the key used to retrive the status of the virtual key in the keyboard is
GetKeyStatewhich is the flag for this challengecrew{GetKeyState}
Attack 8⌗
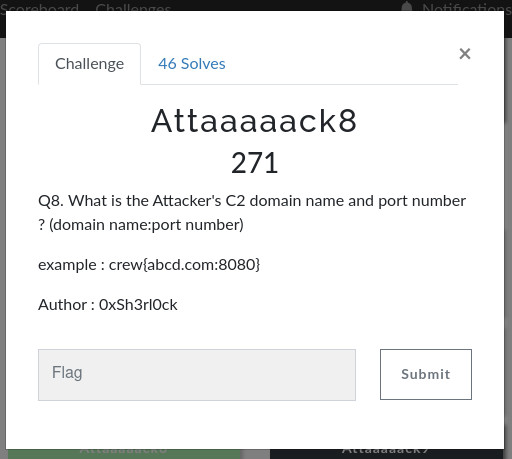
- To find the Attacker’s c2 domain, we can dump the memory of the process just like before
$ volatility -f memdump.raw  --profile=Win7SP1x86_23418 memdump --dump-dir /tmp/test -p 300
Volatility Foundation Volatility Framework 2.6.1
************************************************************************
Writing runddl32.exe [   300] to 300.dmp
- Going through the memory dump for the process , I found some interesting strings that appeared to be configs for the malware,

- It appears this malware is from a group known as DARKCOMET, fetching all the config strings, we get the c2 domain and port

- Another way is to upload the malware to virus total. Checking the behaviour tab (
https://www.virustotal.com/gui/file/9601b0c3b0991cb7ce1332a8501d79084822b3bdea1bfaac0f94b9a98be6769a/behavior), we find the following c2tcp://test213.no-ip.info:1604
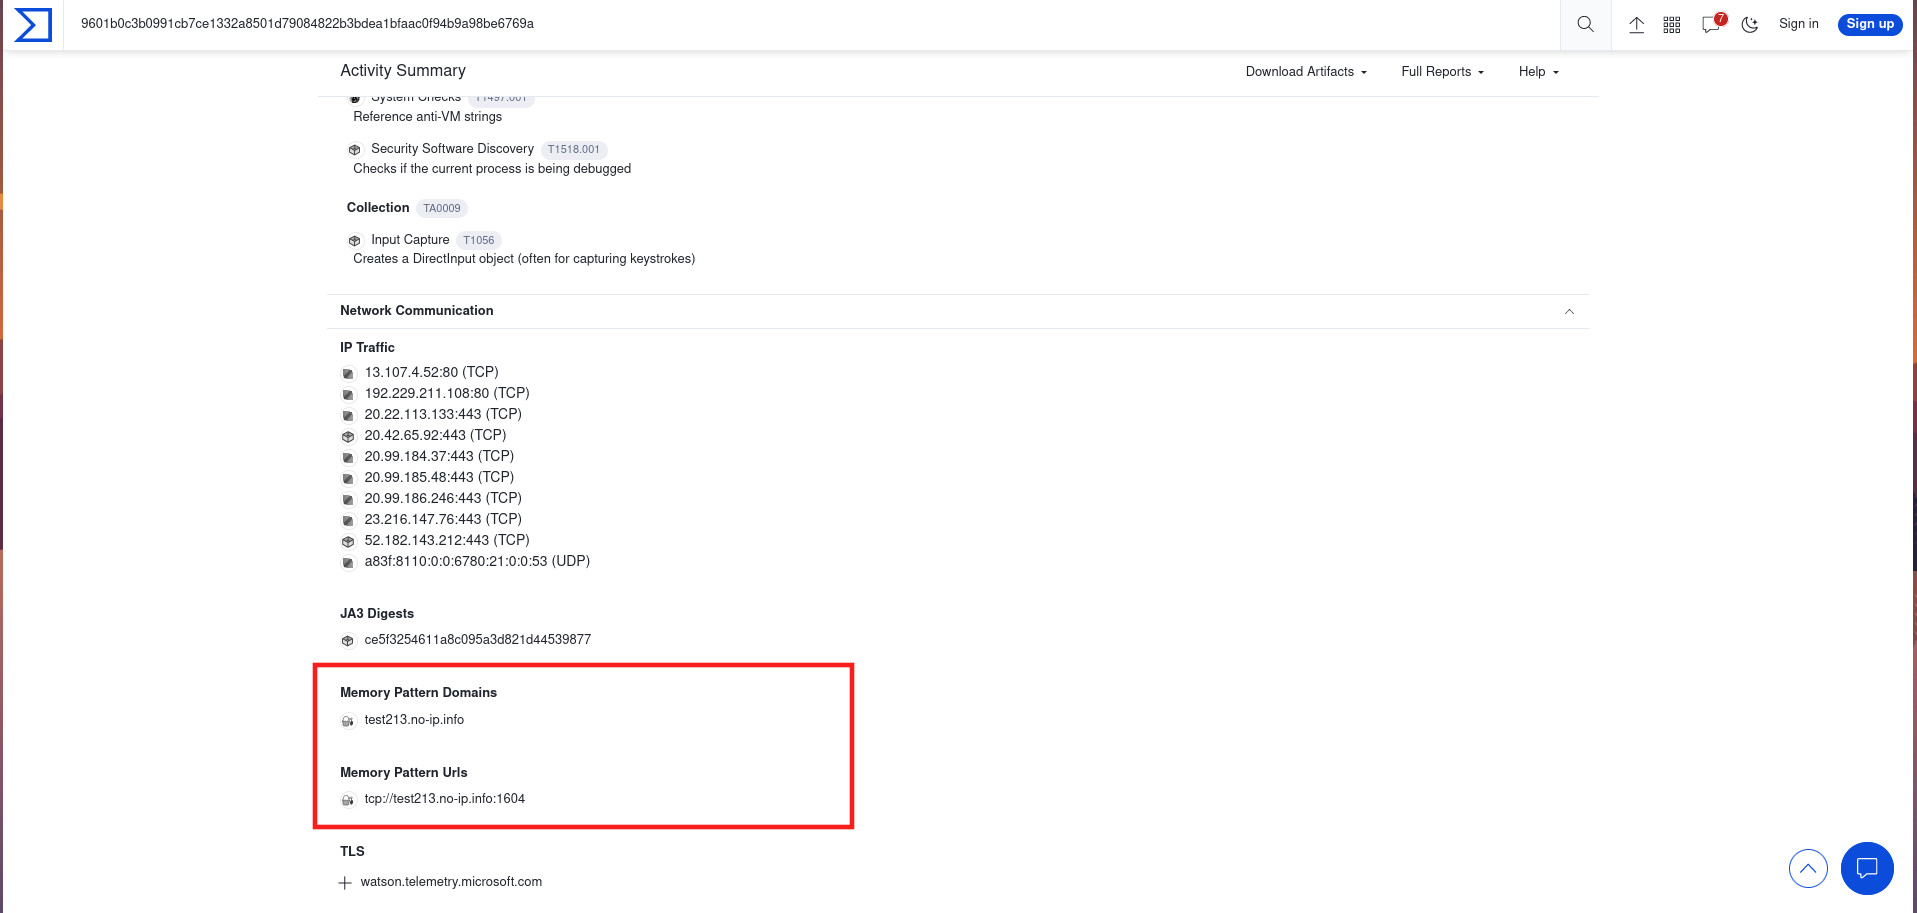
- The flag is
crew{test213.no-ip.info:1604}